Файл:US2009FederalExpenditures.png
Розмір при попередньому перегляді: 600 × 599 пікселів. Інші роздільності: 240 × 240 пікселів | 481 × 480 пікселів | 769 × 768 пікселів | 1025 × 1024 пікселів | 2099 × 2096 пікселів.
Повна роздільність (2099 × 2096 пікселів, розмір файлу: 107 КБ, MIME-тип: image/png)
| Відомості про цей файл містяться на Вікісховищі — централізованому сховищі вільних файлів мультимедіа для використання у проектах Фонду Вікімедіа. |
Опис файлу
| Опис |
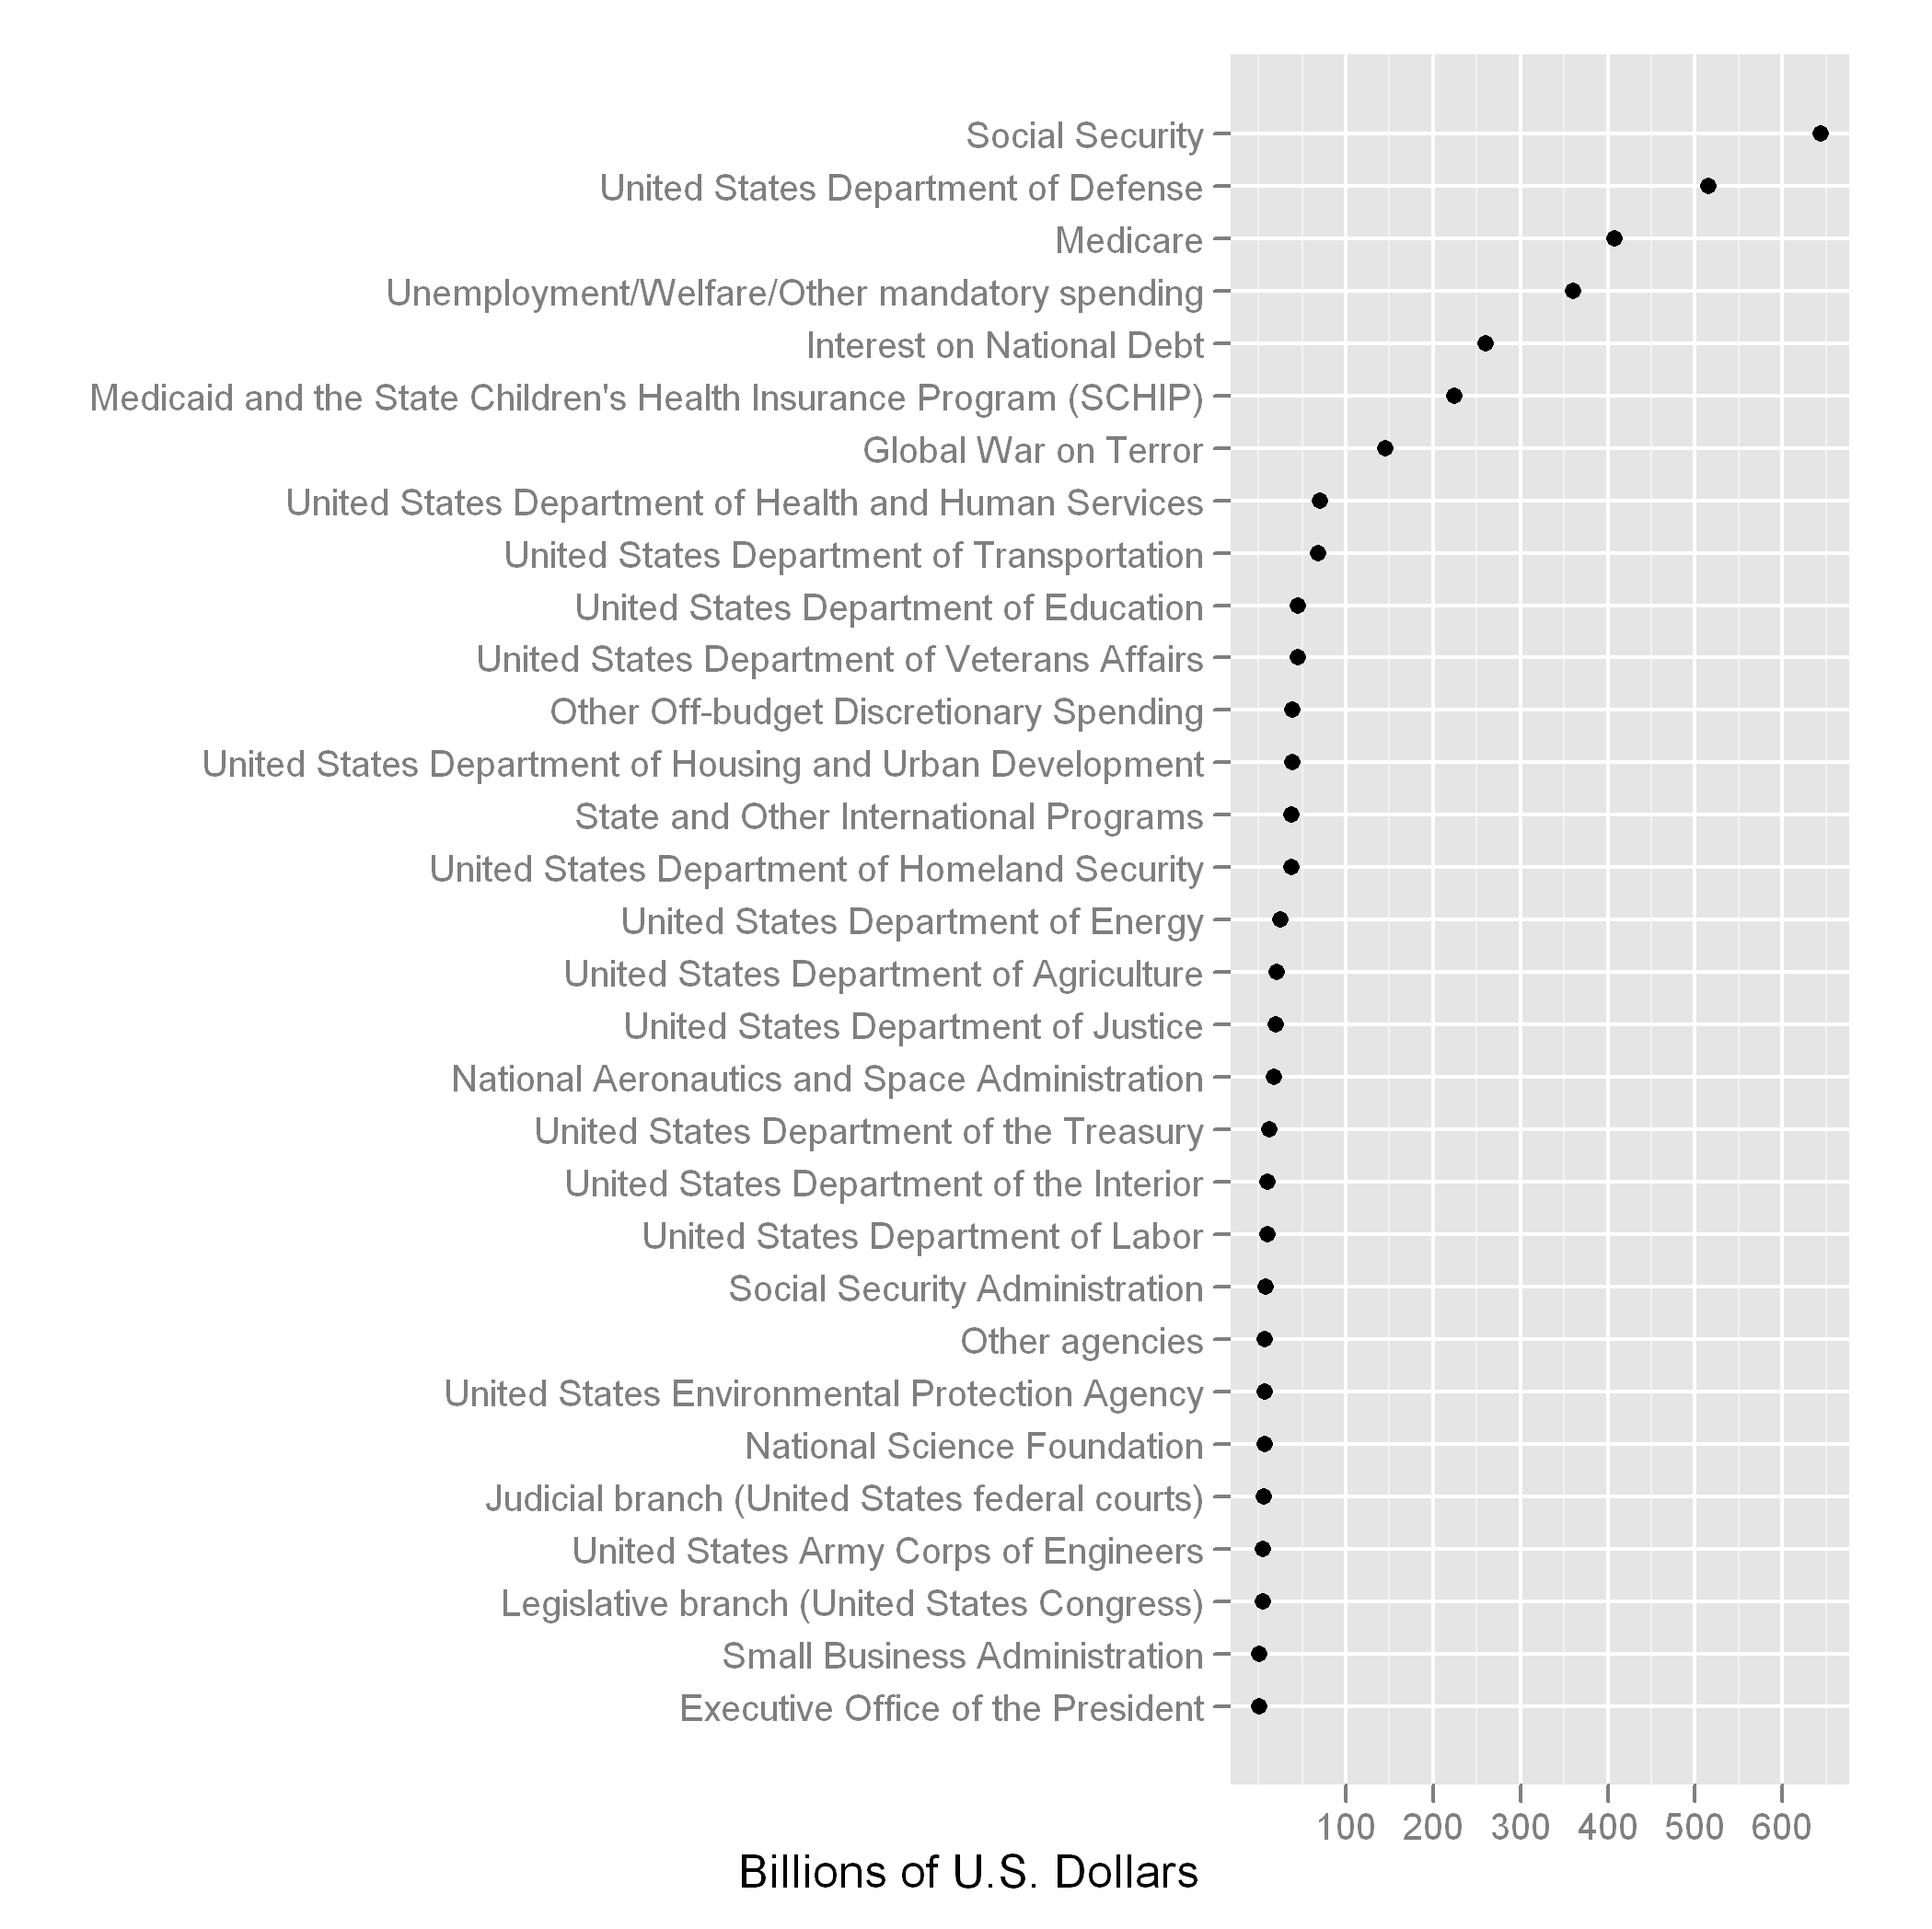
English: Dot plot of the total U.S. government budget in 2009, including both mandatory and discretionary. Taken from data at wikipedia:2009 United States federal budget. |
| Час створення | |
| Джерело | Власна робота |
| Автор | Thopper |
| Інші версії | File:Fy2009spendingbycategory2.png |
Creation Technique
General steps
- Compile data from list of budget items at wikipedia:2009 United States federal budget and save to a file (e.g. "2009expenditures.csv");
- Load data in R (programming language);
- Load the ggplot2 library;
- Assign the categorical variable (outlay) as a factor;
- Plot using the ggplot.
Compiling the data
- Compile the data into columns: one column for the budget expenditure (e.g. "Social Security," "Medicare," etc.) and the other for the amount ("644," "408," etc.).
- Name the columns "Expenditure" and "Billions" for the expenditure category and the amount (in billions of U.S. dollars), respectively.
- Save the data as comma-separated value file (csv).
R code to produce chart
# Load the ggplot2 library
library("ggplot2")

# Data saved using European separators ("." for thousands and "," for decimals), so use read.csv2().
# If data is saved using U.S. separators ("," for thousands and "." for decimals), use read.csv().
my.data <- read.csv2("2009expenditures.csv")

# Ensure that the categories are treated as factors
my.data <- data.frame(Billions = my.data$Billions, Expenditure = factor(my.data$Expenditure))

# Plot using ggplot2
ggplot(data = my.data, aes(Billions)) +
      geom_point(aes(y=reorder(Expenditure, Billions))) +
      xlab("Billions of U.S. Dollars") + ylab("")
Ліцензування
Я, власник авторських прав на цей твір, добровільно публікую його на умовах такої ліцензії:
Цей файл ліцензований на умовах ліцензії Creative Commons Attribution-Share Alike 3.0 Unported
- Ви можете вільно:
- ділитися – копіювати, поширювати і передавати твір
- модифікувати – переробляти твір
- При дотриманні таких умов:
- зазначення авторства – Ви повинні вказати авторство, надати посилання на ліцензію і вказати, чи якісь зміни було внесено до оригінального твору. Ви можете зробити це в будь-який розсудливий спосіб, але так, щоб він жодним чином не натякав на те, наче ліцензіар підтримує Вас чи Ваш спосіб використання твору.
- поширення на тих же умовах – Якщо ви змінюєте, перетворюєте або створюєте іншу похідну роботу на основі цього твору, ви можете поширювати отриманий у результаті твір тільки на умовах такої ж або сумісної ліцензії.
Історія файлу
Клацніть на дату/час, щоб переглянути, як тоді виглядав файл.
| Дата/час | Мініатюра | Розмір об'єкта | Користувач | Коментар | |
|---|---|---|---|---|---|
| поточний | 14:34, 17 вересня 2010 | | 2099 × 2096 (107 КБ) | Thopper | {{Information |Description={{en|1=Dot plot of the total U.S. government budget in 2009, including both mandatory and discretionary. Taken from data at wikipedia:2009 United States federal budget.}} |Source={{own}} |Author=Thopper |Dat |
Використання файлу
Така сторінка використовує цей файл:
Глобальне використання файлу
Цей файл використовують такі інші вікі:
- Використання в cs.wikipedia.org
- Використання в en.wikipedia.org
- Використання в fr.wikipedia.org
- Використання в pl.wikipedia.org
- Використання в www.wikidata.org
- Використання в zh.wikipedia.org