Файл:LowSensitivity HighSpecificity 1400x1050.png

Розмір при попередньому перегляді: 800 × 600 пікселів. Інші роздільності: 320 × 240 пікселів | 640 × 480 пікселів | 1024 × 768 пікселів | 1280 × 960 пікселів | 1400 × 1050 пікселів.
Повна роздільність (1400 × 1050 пікселів, розмір файлу: 91 КБ, MIME-тип: image/png)
| Відомості про цей файл містяться на Вікісховищі — централізованому сховищі вільних файлів мультимедіа для використання у проектах Фонду Вікімедіа. |

|
Ця діаграма має бути конвертована у векторний формат SVG. Це дає декілька переваг, докладніше про які Ви можете прочитати на сторінці Commons:Media for cleanup. Якщо Вам вже зараз доступна векторна версія даного зображення, завантажте її, будь ласка. Після завантаження замініть цей шаблон на такий: {{vector version available|Назва_завантаженого_файлу.svg}}.
|
Опис файлу
| Опис |
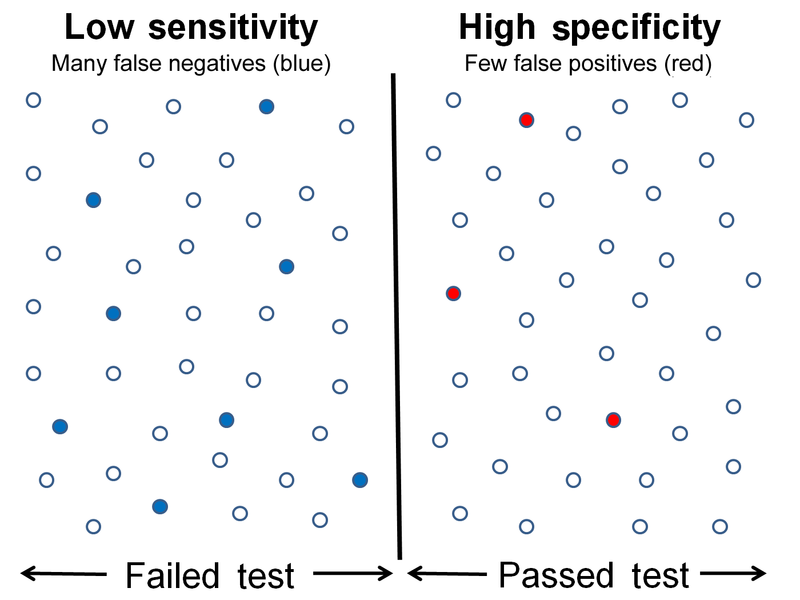
English: Graphical illustration of low sensitivity and high specificity. Each data point is represented by a circle. Data which failed the test are drawn on the left side of the vertical bar and data which passed the test are drawn on the right side of the vertical bar. False negatives are shown as closed blue circles in the left panel and false positives are shown as closed red circles in the right panel. All other data points (open circles) are either true negatives (on the left) or true positives (on the right). |
| Час створення | |
| Джерело | Власна робота |
| Автор | Rmostell |
| Інші версії |
[]
|


Ліцензування
Я, власник авторських прав на цей твір, добровільно публікую його на умовах такої ліцензії:
| Цей файл доступний на умовах Creative Commons CC0 1.0 Universal Public Domain Dedication. | |
| Особа, що пов'язала роботу з даною дією, передала роботу у суспільне надбання шляхом відмови від усіх своїх прав на роботу по всьому світу по закону про авторське право, включаючи всі пов'язані і суміжні права, в тій мірі, що допускається законом.
Ви можете копіювати, змінювати, розповсюджувати і виконувати роботу, навіть на комерційній основі, не питаючи дозволу. |

|
Категорії цього файлу слід перевірити. Перевірте їх зараз!
|
Історія файлу
Клацніть на дату/час, щоб переглянути, як тоді виглядав файл.
| Дата/час | Мініатюра | Розмір об'єкта | Користувач | Коментар | |
|---|---|---|---|---|---|
| поточний | 00:06, 15 травня 2020 | | 1400 × 1050 (91 КБ) | Nyq | decapitalized common nouns |
| 22:01, 6 березня 2011 |  | 1400 × 1050 (76 КБ) | Rmostell | {{Information |Description ={{en|1=Graphical illustration of low sensitivity and high specificity. Each data point is represented by a circle. Data which failed the test are drawn on the left side of the vertical bar and data which passed the test are |
Використання файлу
Нема сторінок, що використовують цей файл.
Глобальне використання файлу
Цей файл використовують такі інші вікі:
- Використання в en.wikipedia.org
- Використання в fa.wikipedia.org
- Використання в th.wikipedia.org
- Використання в ur.wikipedia.org