Файл:GISS temperature 2000-09 lrg.png

Розмір при попередньому перегляді: 800 × 400 пікселів. Інші роздільності: 320 × 160 пікселів | 640 × 320 пікселів | 1024 × 512 пікселів | 1280 × 640 пікселів | 2880 × 1440 пікселів.
Повна роздільність (2880 × 1440 пікселів, розмір файлу: 545 КБ, MIME-тип: image/png)
| Відомості про цей файл містяться на Вікісховищі — централізованому сховищі вільних файлів мультимедіа для використання у проектах Фонду Вікімедіа. |
Опис файлу
| Опис |
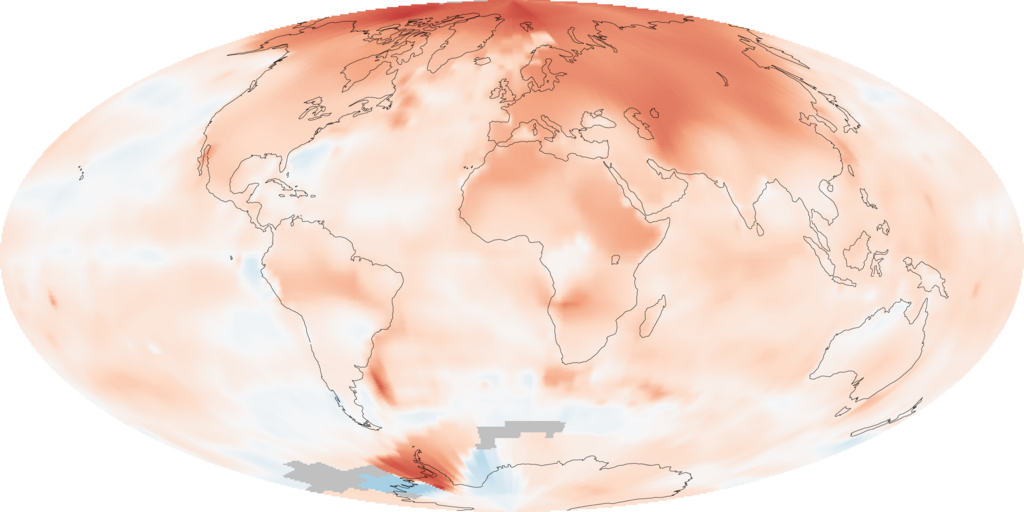
English: The map illustrates just how much warmer temperatures were in the decade (2000-2009) compared to average temperatures recorded between 1951 and 1980 (a common reference period for climate studies). The most extreme warming, shown in red, was in the Arctic. Very few areas saw cooler than average temperatures, shown in blue. Gray areas over parts of the Southern Ocean are places where temperatures were not recorded. The analysis, conducted by the Goddard Institute for Space Studies (GISS) in New York City, is based on temperatures recorded at meteorological (weather) stations around the world and satellite data over the oceans.
|
| Час створення | |
| Джерело | NASA Earth Observatory Image of the Day: 2009 Ends Warmest Decade on Record http://earthobservatory.nasa.gov/IOTD/view.php?id=42392 |
| Автор | NASA images by Robert Simmon, based on data from the Goddard Institute for Space Studies. |
Ліцензування
| Цей файл перебуває у суспільному надбанні, оскільки він був створений NASA (Національним управлінням з аеронавтики і дослідження космічного простору). Згідно з політикою NASA стосовно авторського права, «матеріали NASA не захищаються авторським правом, якщо не вказано протилежне». (Див. Template:PD-USGov, сторінку політики NASA стосовно авторського права, або політику використання зображень JPL.) | ||
 |
Попередження:
|
Історія файлу
Клацніть на дату/час, щоб переглянути, як тоді виглядав файл.
| Дата/час | Мініатюра | Розмір об'єкта | Користувач | Коментар | |
|---|---|---|---|---|---|
| поточний | 03:09, 23 січня 2010 | | 2880 × 1440 (545 КБ) | Petersam | {{Information |Description={{en|1=The map illustrate just how much warmer temperatures were in the decade (2000-2009) compared to average temperatures recorded between 1951 and 1980 (a common reference period for climate studies). The most extreme warming |
Використання файлу
Така сторінка використовує цей файл:
Глобальне використання файлу
Цей файл використовують такі інші вікі:
- Використання в ar.wikipedia.org
- Використання в as.wikipedia.org
- Використання в bn.wikipedia.org
- Використання в bxr.wikipedia.org
- Використання в cs.wikipedia.org
- Використання в en.wikipedia.org
- Використання в en.wikiversity.org
- Використання в es.wikipedia.org
- Використання в fa.wikipedia.org
- Використання в fr.wikipedia.org
- Використання в id.wikipedia.org
- Використання в ilo.wikipedia.org
- Використання в it.wikipedia.org
- Використання в ko.wikipedia.org
- Використання в or.wikipedia.org
- Використання в pnb.wikipedia.org
- Використання в pt.wikipedia.org
- Використання в pt.wikinews.org
- Використання в si.wikipedia.org
- Використання в sv.wikipedia.org
- Використання в vi.wikipedia.org
- Використання в www.wikidata.org
- Використання в zh.wikipedia.org