Файл:E12 values graph.svg

Розмір цього попереднього перегляду PNG для вихідного SVG-файлу: 575 × 420 пікселів. Інші роздільності: 320 × 234 пікселів | 640 × 467 пікселів | 1024 × 748 пікселів | 1280 × 935 пікселів | 2560 × 1870 пікселів.
Повна роздільність (SVG-файл, номінально 575 × 420 пікселів, розмір файлу: 4 КБ)
| Відомості про цей файл містяться на Вікісховищі — централізованому сховищі вільних файлів мультимедіа для використання у проектах Фонду Вікімедіа. |
Опис файлу
| Опис |
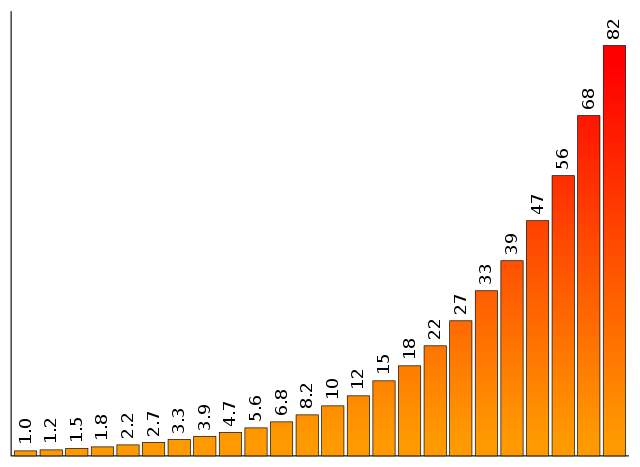
English: Graph showing values of the E12 series, which is used to standardize values of resistors and capacitors. The values shown cover two decades of the series, from 1 to 82, and illustrate the exponential nature of the series. |
| Час створення | |
| Джерело | Own work by uploader, designed to replace original bitmap image Image:E12_values_graph.png |
| Автор | Qef |
| Інші версії | Bitmap version showing the same data, but with superfluous labels, making it not language neutral: Image:E12_values_graph.png |
Ліцензування
| Ця робота була передана у суспільне надбання її автором, Qef. Це застосовується по всьому світу. У деяких країнах це не може бути юридично можливо, в такому випадку: |
Source code
This graph was generated by the Perl program below, which was specially written for the purpose. If changes need to be made, it's probably best to tweak the program and re-run it to get a new version, rather than editing the SVG directly.
use warnings;
use strict;

# The E12 series twice over, the first time divided by 10.
my @VALUES = qw(
    1.0 1.2 1.5 1.8 2.2 2.7 3.3 3.9 4.7 5.6 6.8 8.2
    10  12  15  18  22  27  33  39  47  56  68  82
);

# Parameters to set appearance.
my $AXIS_HT = 400;
my $VERT_SCALE = 4.5;
my $BAR_WIDTH = 20;
my $BAR_GAP = 3;
my $MARGIN = 10;

my $img_wd = ($BAR_WIDTH + $BAR_GAP) * @VALUES + $BAR_GAP + 2 * $MARGIN;
my $img_ht = $AXIS_HT + 2 * $MARGIN;
my $margin_right = $img_wd - $MARGIN;
my $margin_bottom = $img_ht - $MARGIN;

my $x = $MARGIN;
my $graph_path = '';
my $text_cmds = '';
for (@VALUES) {
    $x += $BAR_GAP;
    my $bar_ht = $_ * $VERT_SCALE;
    $graph_path .= "M$x,$margin_bottom v-$bar_ht h$BAR_WIDTH v$bar_ht Z\n";
    $x += $BAR_WIDTH;
    my $bar_top = $img_ht - $bar_ht - $MARGIN + -5;
    my $txt_x = $x - 0.5 * $BAR_WIDTH + 4.5;
    $text_cmds .= "  <text transform='translate($txt_x,$bar_top) rotate(270)'" .
                  " x='0' y='0' fill='#000' text-anchor='start'>$_</text>\n";
}

print <<"END";
<?xml version="1.0" encoding="UTF-8"?>
<svg version="1.0" width="$img_wd" height="$img_ht"
     xmlns="http://www.w3.org/2000/svg">

 <defs>
  <linearGradient id="grad" x2="0%" y1="0%" y2="100%">
   <stop offset="5%" stop-color="#F00" />
   <stop offset="95%" stop-color="#F90" />
  </linearGradient>
 </defs>

 <path stroke="#000" stroke-width="1" fill="none"
       d="M$MARGIN,$MARGIN V$margin_bottom H$margin_right"/>
 <path stroke="#000" stroke-width="0.6" fill="url(#grad)" d="$graph_path"/>
 <path stroke="#333" stroke-width="0.6" fill="url(#grad)" d="$graph_path">
 </g>
</svg>
END
Історія файлу
Клацніть на дату/час, щоб переглянути, як тоді виглядав файл.
| Дата/час | Мініатюра | Розмір об'єкта | Користувач | Коментар | |
|---|---|---|---|---|---|
| поточний | 17:07, 3 липня 2008 | | 575 × 420 (4 КБ) | Qef | {{Information |Description={{en|1=Graph showing values of the E12 series, which is used to standardize values of resistors and capacitors. The values shown cover two decades of the series, from 1 to 82, and illustrates the exponential nature of the serie |
Використання файлу
Така сторінка використовує цей файл:
Глобальне використання файлу
Цей файл використовують такі інші вікі:
- Використання в bg.wikipedia.org
- Використання в da.wikipedia.org
- Використання в de.wikipedia.org
- Використання в en.wikipedia.org
- User:Augur
- User:VinceyB
- User:Simen 88
- User:NekrosKoma
- User:Masterhomer
- Wikipedia:Userboxes/Philosophy
- User:MaesterTonberry
- User:Java7837/userboxing/Singularitarian
- User:Saukkomies/My userboxes
- User:Vaerinn
- User:Keskival
- User:Test35965
- User:Elsa-and-Anya
- User:ImmortalRationalist
- User:KiefKief
- User:AnnonJung
- User:Thablaqkgoat
- User:FrederickII
- E series of preferred numbers
- User:AllanVolt
- User:Just an ordinary human
- User:HeyTomek
- User:Berkay123456789
- Використання в en.wikiversity.org
- Використання в eo.wikipedia.org
- Використання в et.wikipedia.org
- Використання в he.wikipedia.org
- Використання в zh.wikipedia.org