Файл:Animation of projected annual mean surface air temperature from 1970-2100, based on SRES emissions scenario A1B (NOAA GFDL CM2.1).webm
Розмір цього попереднього перегляду JPG для вихідного WEBM-файлу: 800 × 450 пікселів. Інші роздільності: 320 × 180 пікселів | 640 × 360 пікселів | 1280 × 720 пікселів.
Повна роздільність (Аудіо-/відеофайл WebM, VP8, тривалість — 44с, 1280 × 720 пікселів, швидкість —1,99 Mbps)
| Відомості про цей файл містяться на Вікісховищі — централізованому сховищі вільних файлів мультимедіа для використання у проектах Фонду Вікімедіа. |
Опис файлу
| Опис |
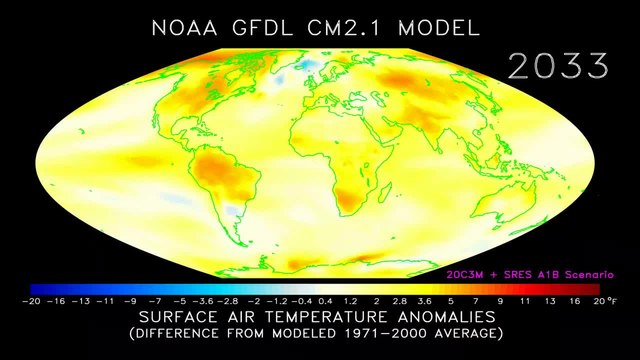
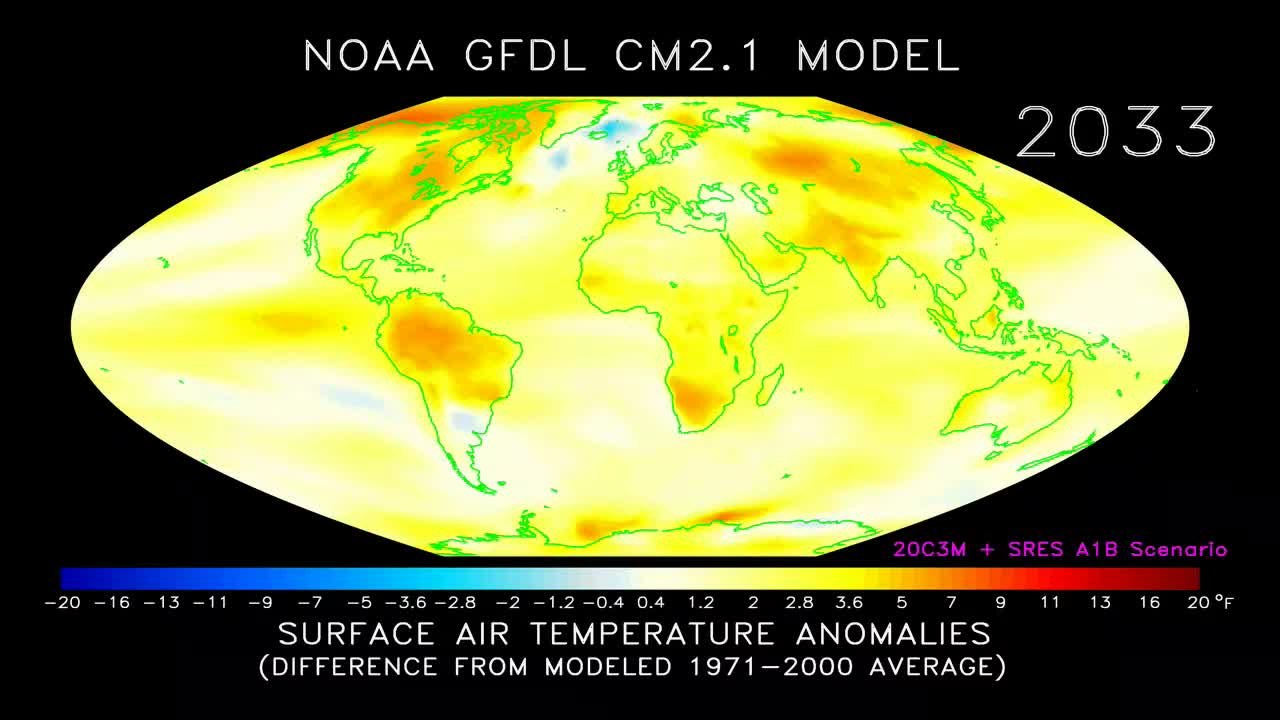
English: Description is based on the NOAA (2011) public-domain source: This animation depicts the time evolution of annual mean surface air temperature changes as projected by the NOAA GFDL CM2.1 climate model. The animations show the time period 1970 to 2100. For each time level shown, the temperature differences (or anomalies) were calculated by subtracting the model-simulated average for the years 1971 to 2000 from the time varying 21st century model-projected temperatures. The change is in response to increasing atmospheric concentrations of greenhouse gases and aerosols based on a "middle of the road" estimate of future emissions. Future emissions are based on the "A1B" emissions scenario, taken from the Special Report on Emissions Scenarios. These animations were produced using the output of the CM2.1 "H2" historical experiment for the 20th century time period and the CM2.1 SRES A1B run for the 2001-2100 period.
From the NOAA (2007) public-domain source: The term “global warming” is commonly used to refer to surface air temperature changes that are a response to increasing atmospheric greenhouse gas (GHG) concentrations. However, the warming is not expected to be uniform over the globe, nor is it expected to be the same during all seasons of the year. Computer model simulations conducted at NOAA’s Geophysical Fluid Dynamics Laboratory (GFDL) and elsewhere project that GHG induced warming will be more rapid over land masses than over oceans. In the animation, red colors indicate greater warming over the continents. White and blue-green colors mark areas with the least warming or slight cooling, found mostly over oceans. Additionally, the greatest warming is expected during the winter over northern North America and north-central Asia. The animation shows variability in year-to-year temperature changes, but generally, earlier years are cooler than later years. The animation starts off (1970s) showing most areas blue (-5 to -2 °F relative to the 1971-2000 average) or yellow (+2 to +3.6 °F). By 2000, yellow begins to dominate. By 2050, most land areas have turned orange or red (+5 to +11 °F), with most ocean areas yellow. By 2099, land areas are more reddish (+9 to +14 °F), with most ocean areas yellow or orange. References:
Čeština: Animace ročních průměrných teplot vzduchu na zemském povrch v letech 1970 - 2100 na základě výpočtového modelu amerického Národního úřadu pro oceán a atmosféru (NOAA).
Македонски: Средната годишна површинска температура на воздухот од 1970 до 2100 г.
Polski: Stworzona przez NOAA animacja przedstawiająca prognozowaną średnioroczną temperaturę powietrza na powierzchni Ziemi w latach 1970–2100.
Русский: Анимация прогнозируемой среднегодовой температуры воздуха у поверхности планеты Земля в интервале с 1970 по 2100 годы. |
| Час створення | |
| Джерело | 1280 x720 resolution, 30 fps .mov format 1971-2100, 1305 frames total, 43.3 seconds at 30 fps (27MB), in: NOAA GFDL Climate Research Highlights Image Gallery: Patterns of Greenhouse Warming, publisher: NOAA GFDL. Retrieved 2012-10-13. |
| Автор | NOAA Geophysical Fluid Dynamics Laboratory (GFDL) |
Ліцензування
This image is in the public domain because it contains materials that originally came from the U.S. National Oceanic and Atmospheric Administration, taken or made as part of an employee's official duties.
|
Оцінка
| Цей файл обраний медіафайлом дня за 21 квітня 2015. Назва файлу:
English: Animation of annual mean surface air temperature from 1970-2100, by the National Oceanic and Atmospheric Administration GFDL CM2.1 climate model.
Іншими мовами
Čeština: Animace ročních průměrných teplot vzduchu na Zemi v období 1970-2100,vytvořený Národním úřadem pro oceán a atmosféru (NOAA) s použitím Globálního klimatického modelu CM2.1. English: Animation of annual mean surface air temperature from 1970-2100, by the National Oceanic and Atmospheric Administration GFDL CM2.1 climate model. Polski: Stworzona przez NOAA animacja przedstawiająca prognozowaną średnioroczną temperaturę powietrza na powierzchni Ziemi w latach 1970–2100. 中文(简体):地球年均气温变化
|
| Цей файл обраний медіафайлом дня за 24 лютого 2018. Назва файлу:
English: Animation of projected annual mean surface air temperature from 1970 to 2100.
Іншими мовами
Čeština: Animace ročních průměrných teplot vzduchu na zemském povrch v letech 1970 - 2100 na základě výpočtového modelu amerického Národního úřadu pro oceán a atmosféru (NOAA). English: Animation of projected annual mean surface air temperature from 1970 to 2100. Македонски: Средната годишна површинска температура на воздухот од 1970 до 2100 г. Polski: Stworzona przez NOAA animacja przedstawiająca prognozowaną średnioroczną temperaturę powietrza na powierzchni Ziemi w latach 1970–2100. Русский: Анимация прогнозируемой среднегодовой температуры воздуха у поверхности планеты Земля в интервале с 1970 по 2100 годы.
|
Історія файлу
Клацніть на дату/час, щоб переглянути, як тоді виглядав файл.
| Дата/час | Мініатюра | Розмір об'єкта | Користувач | Коментар | |
|---|---|---|---|---|---|
| поточний | 05:50, 28 листопада 2013 | 44с, 1280×720 (10,33 МБ) | Enescot | User created page with UploadWizard |
Використання файлу
Така сторінка використовує цей файл:
Глобальне використання файлу
Цей файл використовують такі інші вікі:
- Використання в cs.wikipedia.org
- Використання в en.wikipedia.org
- Використання в mk.wikipedia.org
- Використання в tt.wikipedia.org