Файл:South Africa 2011 dominant population group map.svg

Розмір цього попереднього перегляду PNG для вихідного SVG-файлу: 684 × 599 пікселів. Інші роздільності: 274 × 240 пікселів | 548 × 480 пікселів | 876 × 768 пікселів | 1168 × 1024 пікселів | 2337 × 2048 пікселів | 809 × 709 пікселів.
Повна роздільність (SVG-файл, номінально 809 × 709 пікселів, розмір файлу: 787 КБ)
| Відомості про цей файл містяться на Вікісховищі — централізованому сховищі вільних файлів мультимедіа для використання у проектах Фонду Вікімедіа. |
Опис файлу
| Опис |
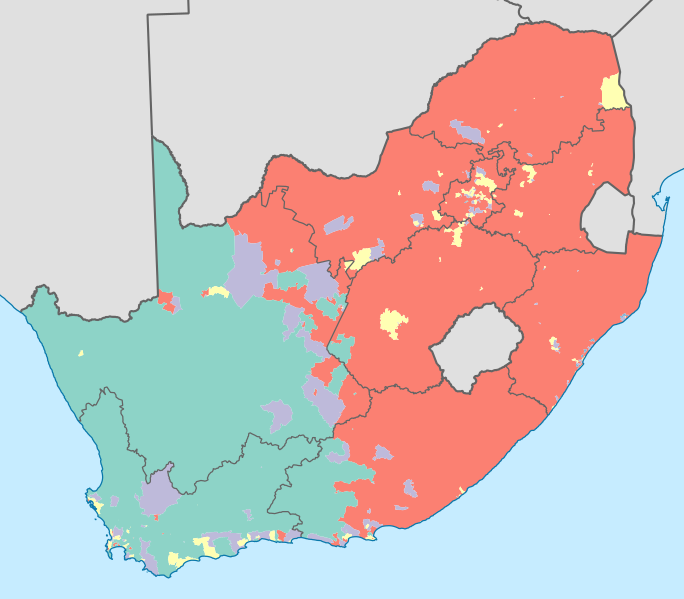
English: Map showing the dominant population groups in South Africa, according to Census 2011, at electoral ward level. A population group is considered dominant if it makes up more than 50% of the population in a ward, or if it makes up more than 33% and no other group makes up more than 25%.
Black African
Coloured
Indian or Asian
White
No group dominant
Projection is Albers Equal-Area Conic, with standard parallels at 25.5° S and 31.5° S, and origin at 28.5° S 25.5° E. |
| Час створення | |
| Джерело | Statistics South Africa's Census 2011 is the source of the basic population data. The map results from my own processing of the data. The map results from my own processing of the data. For ward boundaries see File:South Africa electoral wards 2011 blank.svg. |
| Автор | Htonl |
| Інші версії |
South Africa 2011 dominant population group map (hex cells).svg: .svg) |
Ліцензування
The following license applies to the population data on which the map is based:

|
Власник авторських прав на цей файл, Stats SA, дозволяє використовувати файл для будь-яких цілей, при умові збереження інформації про власника авторських прав. Дозволяється розповсюдження цього файлу, створення похідних робіт, а також комерційне та будь-яке інше використання. |
Зазначення авторства:
"the user acknowledges Stats SA as the source of the basic data wherever they process, apply, utilise, publish or distribute the data, and also that they specify that the relevant application and analysis (where applicable) result from their own processing of the data" [1]
|
The following tag applies to the map itself:
| Я, власник авторських прав на цю роботу, передаю роботу в суспільне надбання. Застосовується по всьому світу. У деяких країнах це не може бути юридично можливо, в такому випадку: Я даю кожному право на використання цієї роботи для будь-яких цілей, без будь-яких умов, якщо такі умови не вимагаються за законом. |
Історія файлу
Клацніть на дату/час, щоб переглянути, як тоді виглядав файл.
| Дата/час | Мініатюра | Розмір об'єкта | Користувач | Коментар | |
|---|---|---|---|---|---|
| поточний | 00:13, 17 квітня 2013 | | 809 × 709 (787 КБ) | Htonl | =={{int:filedesc}}== {{Information |Description={{en|1=Map showing the dominant population groups in South Africa, according to Census 2011, at electoral ward level. A population group is considered dominant if it makes up more than 50% of the populati... |
Використання файлу
Така сторінка використовує цей файл:
Глобальне використання файлу
Цей файл використовують такі інші вікі:
- Використання в af.wikipedia.org
- Використання в cs.wikipedia.org
- Використання в es.wikipedia.org
- Використання в fr.wikipedia.org
- Використання в he.wikipedia.org
- Використання в it.wikipedia.org
- Використання в ka.wikipedia.org
- Використання в pt.wikipedia.org
- Використання в ro.wikipedia.org
- Використання в ru.wikipedia.org
- Використання в sr.wikipedia.org
- Використання в tg.wikipedia.org
- Використання в zh.wikipedia.org