Файл:Schematic illustration of the analysis framework.jpg

Повна роздільність(1013 × 1199 пікселів, розмір файлу: 720 КБ, MIME-тип: image/jpeg)

Wikimedia Commons logo Відомості про цей файл містяться на Вікісховищі — централізованому сховищі вільних файлів мультимедіа для використання у проектах Фонду Вікімедіа.

Опис файлу

Опис
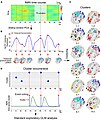
English: (A) Example timecourses of fMRI signals extracted from regions of interest (ROIs). The vertical and horizontal axes indicate ROIs and time, respectively. The color indicates the magnitude of standardized fMRI signals. The brighter rectangle area indicates a window where ROIs timecourses showed temporal sectorization [TS; see (B)], and broken vertical red lines indicate TS time points. (B) Example timecourse of the variance explained by the first principal component (1st PC, blue line). Red dots indicate local maxima of the variance, when fMRI signal temporally synchronized. ROIs showing strong synchronization were mapped onto the 3D surface of the brain. Colors of the ROIs indicate resting networks identified in prior work (Power et al., 2011). (C) Temporal synchronization patterns were labeled as clusters based on a transition matrix across the cluster in Supplementary Figure S3A. ROI-based pattern for each 12 cluster centroids comprising 6 pairs of clusters mapped onto the 3D surface of the standard brain. (D) Timecourses of cluster occurrence (top). The vertical and horizontal axes indicate clusters and time, respectively. The occurrences of clusters are indicated by blue dots. The occurrences of the clusters were coded as events in fMRI time series modeling (bottom). Blue and green solid lines indicate event onsets and BOLD model of the cluster occurrence. Whole-brain exploratory standard event-related GLM analysis was performed using resting-state data.
Час створення
Джерело https://www.frontiersin.org/articles/10.3389/fninf.2022.960607/full
Автор Yusuke Noro, Ruixiang Li, Teppei Matsui, Koji Jimura

Ліцензування

w:uk:Creative Commons
зазначення авторства
Цей файл доступний на умовах ліцензії Creative Commons Із зазначенням авторства 4.0 Міжнародна
Ви можете вільно:
  • ділитися – копіювати, поширювати і передавати твір
  • модифікувати – переробляти твір
При дотриманні таких умов:
  • зазначення авторства – Ви повинні вказати авторство, надати посилання на ліцензію і вказати, чи якісь зміни було внесено до оригінального твору. Ви можете зробити це в будь-який розсудливий спосіб, але так, щоб він жодним чином не натякав на те, наче ліцензіар підтримує Вас чи Ваш спосіб використання твору.

Підписи

Додайте однорядкове пояснення, що саме репрезентує цей файл
Schematic illustration of the analysis framework

Об'єкти, показані на цьому файлі

зображує

Історія файлу

Клацніть на дату/час, щоб переглянути, як тоді виглядав файл.

Дата/часМініатюраРозмір об'єктаКористувачКоментар
поточний18:13, 12 грудня 2023Мініатюра для версії від 18:13, 12 грудня 20231013 × 1199 (720 КБ)DoctorNaturopathUploaded a work by Yusuke Noro, Ruixiang Li, Teppei Matsui, Koji Jimura from https://www.frontiersin.org/articles/10.3389/fninf.2022.960607/full with UploadWizard

Така сторінка використовує цей файл:

Метадані