Файл:Estradiol during menstrual cycle.png

Повна роздільність (3682 × 1640 пікселів, розмір файлу: 492 КБ, MIME-тип: image/png)
| Відомості про цей файл містяться на Вікісховищі — централізованому сховищі вільних файлів мультимедіа для використання у проектах Фонду Вікімедіа. |
Опис файлу
| Опис |
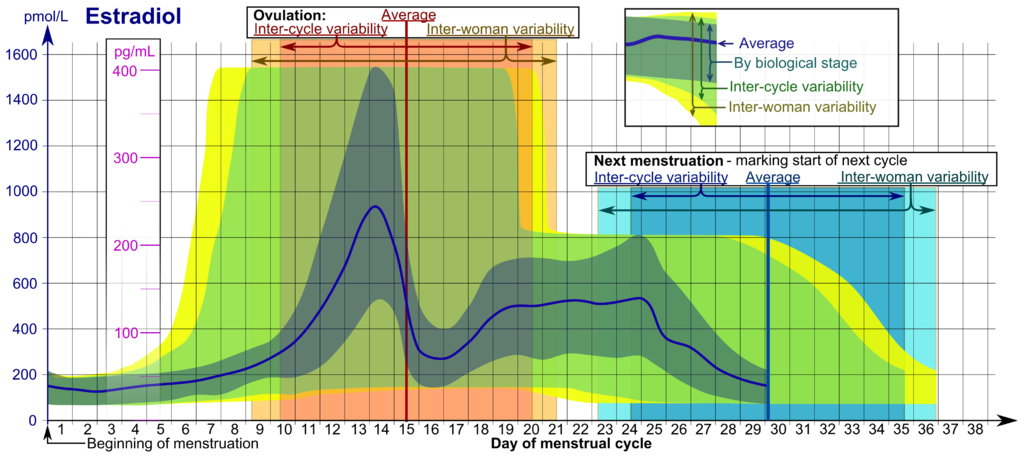
English: Reference ranges for the blood content of estradiol during the menstrual cycle.
InterpretationThe time scale starts with the beginning (or "onset") of (last) menstrual period (LMP), given as day number. Day number 1 corresponds to 0 to 0.99 days from LMP, and Day number 2 corresponds to 1.00 to 1.99 days from LMP and so forth. The time scale ends at whatever is the actual next menstruation, which marks the beginning of the next cycle, which is equivalent to starting all over again from the beginning of the time scale.
Hormone levels represent usual ones, not necessarily related to what is healthy. Hormone ranges vary between cases at the same biological stage of the menstrual cycle. Furthermore, the actual timing (usually given in day numbers from mentruation) of that biological stage varies, both between cycles of any single woman (inter-cycle) and between somen (inter-woman). Therefore, the appropriate ranges to use depend on how certain the actual biological stage can be estimated at any time.
DerivationSee source article:
|
||
| Час створення | |||
| Джерело |
Власна робота.
 |
||
| Автор |
This image can be cited as:
|
||
| Інші версії |
|

Ліцензування
| Я, власник авторських прав на цю роботу, передаю роботу в суспільне надбання. Застосовується по всьому світу. У деяких країнах це не може бути юридично можливо, в такому випадку: Я даю кожному право на використання цієї роботи для будь-яких цілей, без будь-яких умов, якщо такі умови не вимагаються за законом. |
Історія файлу
Клацніть на дату/час, щоб переглянути, як тоді виглядав файл.
| Дата/час | Мініатюра | Розмір об'єкта | Користувач | Коментар | |
|---|---|---|---|---|---|
| поточний | 14:03, 22 січня 2011 | | 3682 × 1640 (492 КБ) | Mikael Häggström | Some fixes |
| 07:23, 22 січня 2011 | 4279 × 1640 (524 КБ) | Mikael Häggström | {{Information |Description={{en|1=Estradiol {{Description of menstrual cycle diagrams}}}} |Source={{own}} |Author=Mikael Häggström |Date=2011-01-22 |Permission= |other_versions= }} |
Використання файлу
Така сторінка використовує цей файл:
Глобальне використання файлу
Цей файл використовують такі інші вікі:
- Використання в ar.wikipedia.org
- Використання в as.wikipedia.org
- Використання в bs.wikipedia.org
- Використання в de.wikipedia.org
- Використання в en.wikipedia.org
- Використання в en.wikiversity.org
- Використання в es.wikipedia.org
- Використання в gl.wikipedia.org
- Використання в he.wikipedia.org
- Використання в hy.wikipedia.org
- Використання в id.wikipedia.org
- Використання в ml.wikipedia.org
- Використання в pt.wikipedia.org
- Використання в sl.wikipedia.org
- Використання в sr.wikipedia.org
- Використання в sv.wikipedia.org
- Використання в www.wikidata.org
- Використання в zh.wikipedia.org
- Використання в zh.wikiversity.org